
- Home
- Know How
- Thermal Imaging Camera
- Thermal imaging camera applications: buildings, electrical, maintenance & PV | Testo
Thermal imaging camera applications:
Find anomalies and assess them safely
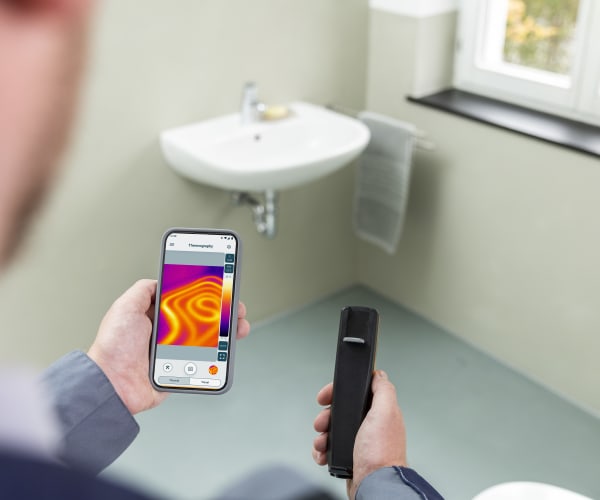
Thermal imaging cameras are mainly used to locate temperature anomalies quickly: thermal bridges in buildings, hotspots in electrical systems, overloaded components in maintenance or defects in PV modules. Thermography becomes meaningful when the recording conditions suit the application (e.g. weather/temperature difference in buildings, load state in electrical inspection, irradiation for PV) and results are documented reproducibly.
What are thermal imaging cameras typically used for?
Typical fields of application are building thermography (energy loss, leaks, mold risk), electrical inspection (overheated connections/components), maintenance & predictive maintenance (hotspots on bearings/motors), HVAC/R (diagnostics on systems and distribution) and photovoltaics (hotspots and connection problems). In all cases, thermography is particularly strong as a screening method: it shows “where” something is conspicuous – and thus provides the basis for prioritization, follow-up measurement and documentation.
Overview of thermal imaging camera applications
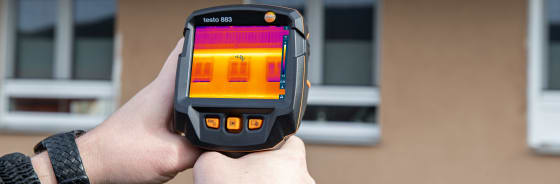

Building thermography: thermal bridges, leaks and mold risk
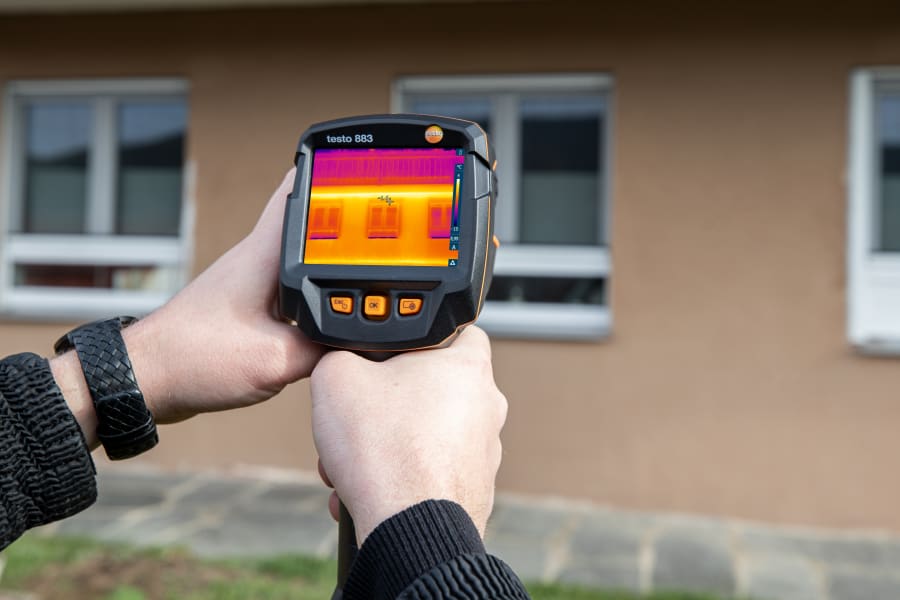
In buildings, thermography makes temperature distributions visible on surfaces, for example on exterior walls, ceiling connections, window reveals and pipe routes. Its benefit is that deviations can be identified quickly and checked in a targeted way instead of renovating without a clear diagnosis.
Typical questions are: Where is heat being lost? Where are thermal bridges? Where is a leak in the building envelope likely? Which areas show unusual cooling that may point to moisture/mold risk? Measurement points are often connections, corners, transitions and surfaces with suspected insulation problems.
Meaningful building thermography requires suitable conditions. A sufficient temperature difference between inside and outside improves contrast, while wind and rain can cool surfaces and distort interpretation. Direct sunlight often causes heating effects that must not be confused with insulation quality. The measurement conditions should therefore always be documented.
Screening: locate conspicuous areas (with a consistent scale and focus).
Verification: check suspected areas with suitable additional measurements (e.g. humidity/surface temperature measurement, air leakage tests – depending on the setup).
Documentation: name measurement points clearly and capture them comparably (same perspective, scale, distance).
Electrical inspection: detecting hotspots in control cabinets and connections
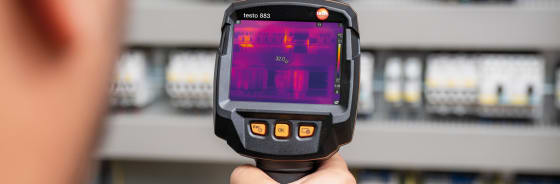
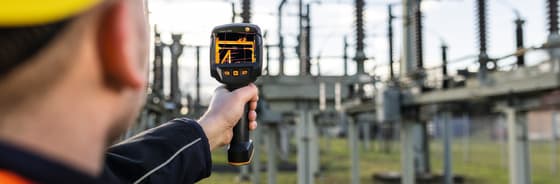
During electrical inspections, thermography shows temperature differences at components, connections and cables. This is particularly useful because many problems first become visible as local heating, often before shutdowns or consequential damage occur.
Common causes are increased contact resistance at connections, uneven load distribution or thermally stressed components. What matters: a hotspot is an indication, not a diagnosis. The cause must be confirmed by visual inspection, measurement (e.g. current/voltage) and, if necessary, maintenance measures.
The significance depends strongly on the load state: without a relevant load, critical points may remain inconspicuous. Safe accessibility, measurement distance (IFOV) and reproducible recording conditions are equally decisive. For control cabinets, what counts in practice is less the “absolutely correct temperature” than comparability across measurement points and over time.
A standard is worthwhile for recurring inspections: same measurement points, identical scale (or a defined scale logic), documented distance and clear naming. This makes trends visible (e.g. “hotspot becomes stronger over months”) and allows actions to be prioritized.

Preventive maintenance
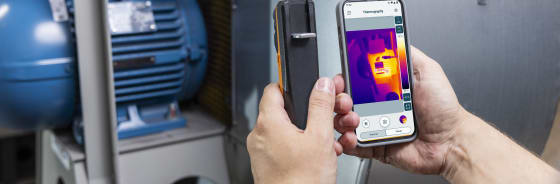
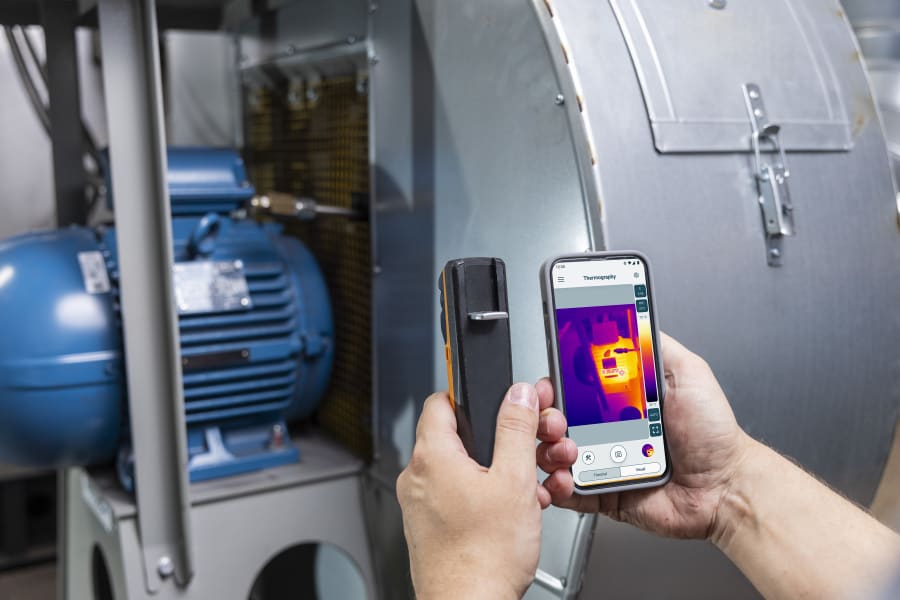
In maintenance, thermography primarily supports rapid prioritization: which machine, bearing or drive is conspicuous and should be checked specifically during the next service?
Thermography is often used on motors, bearings, couplings, gearboxes, pumps and conveying equipment. The advantage is that measurements can be taken during operation without touching components.
Thermography becomes meaningful when a reference state, such as normal operation, is defined and measurements are repeated under similar conditions. This reduces misinterpretation caused by changing loads, ambient heat or seasonal effects.
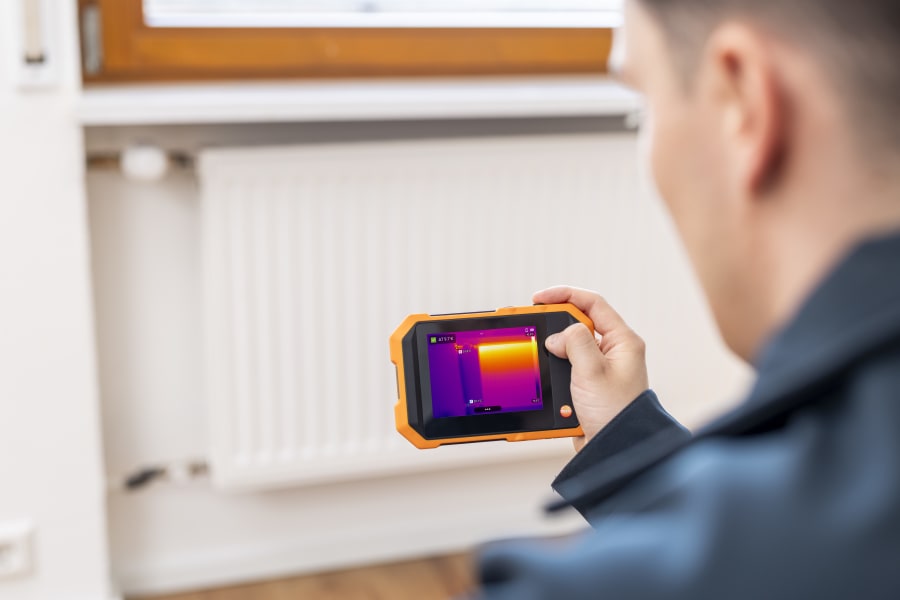
Heating, ventilation, air conditioning and refrigeration
In HVAC/R applications, thermography is especially useful for locating anomalies at components and distribution systems, such as uneven heating, unwanted heat losses or indications of malfunctions.
Typical tasks include assessing temperature distributions, finding leaks or insulation anomalies and quickly diagnosing heat exchangers and pipes.
For interpretation, remember that thermography measures surfaces. For insulated pipes, air temperatures or medium temperatures, additional measurements (contact, Smart Probes, and surface/penetration probes) are often needed to confirm the diagnosis.
Photovoltaics & solar
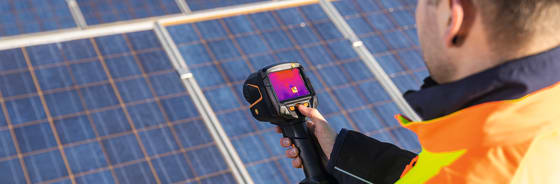
For PV systems, thermography is a fast screening method for making hotspots and anomalies visible. It can provide indications of cell damage, contact problems or string anomalies.
Typical anomalies include locally overheated areas, uneven heating in module surfaces and conspicuous connection areas. Evaluation is ideally performed in the context of the system parameters.
Meaningful PV thermography depends strongly on irradiation and load state. Without sufficient irradiation, temperature contrasts are lower. Viewing angle, reflections such as the sky, and measurement distance/IFOV also affect the visibility of small defects.

Other fields of application
Power generation and distribution
In power plants, substations and distribution networks, thermography helps detect overheated contacts, terminals and busbars at an early stage. Defined load conditions and reproducible measurement points are important so that trends can be assessed reliably.
Industrial manufacturing
In production environments, thermography is used to monitor drives, bearings, conveying equipment, or molds and tools during operation. Relevant questions include: Does a line deviate from the reference line? Are certain components becoming systematically warmer? Fixed measurement points and clear tolerance bands make it possible to integrate thermal behavior into predictive maintenance.
Facility management
For facility management, thermography combines typical tasks from building thermography and HVAC/R: anomalies in insulation, pipe networks, heating circuits and ventilation components become visible quickly. Regular, identically structured rounds (same routes, same scale logic) make it easier to detect deviations over time.
Next steps: guides and instrument selection
Once you have narrowed down your application, the next steps are usually to deepen the relevant fundamentals (ε/RTC/IFOV), define a workflow with reproducible documentation and select a camera whose resolution and lens match the object size and distance.
Do you have questions or would you like personal advice? Contact us!
We look forward to supporting you with our expertise and individual solutions.