Directly from the manufacturer
Free delivery Australia wide
Fast delivery
Secure payment
Directly from the manufacturer
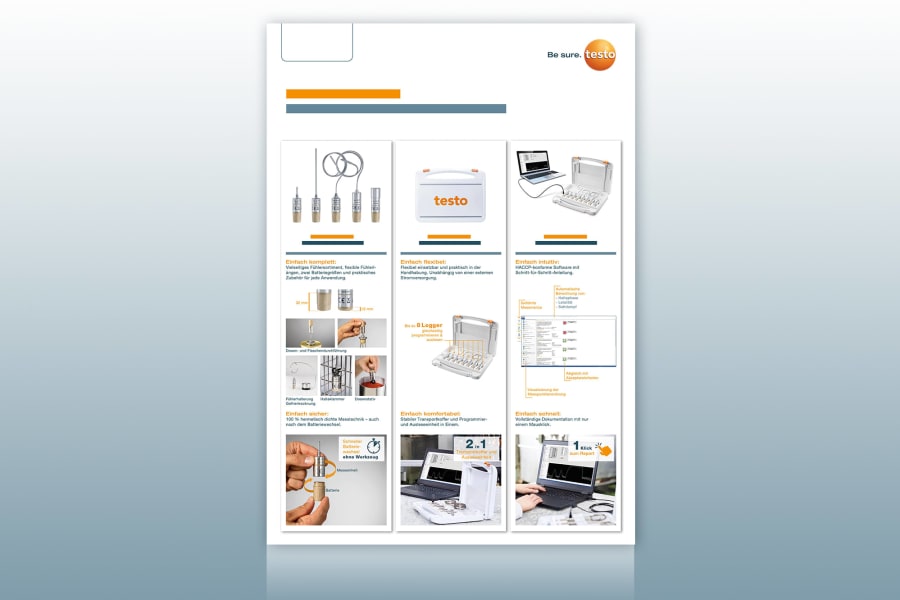
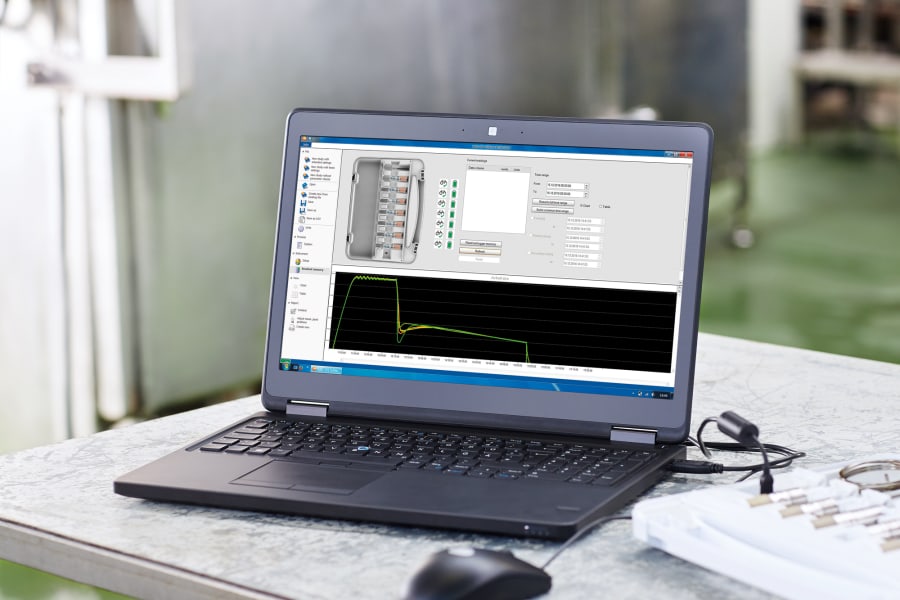
The testo 191 Software Professional: Intuitive and clearly structured
Most software solutions for data loggers used for validation and qualification in the food industry are confusing and complicated. Thus, when developing the testo 191 Software Professional, we particularly focused on making it as intuitive as possible to use. Because we believe that our data logger software is supposed to reduce your workload rather than increase it.
Advantages of using the testo 191 Professional software
Preset process templates with guided work steps
Flexible evaluation of multiple or individual measuring cycles in just one click
Simple implementation of key calculations (e.g. holding phases, lethality, saturated steam quality)
Target/actual comparison of freely definable acceptance criteria
Visualization of the measurement set-up
Fast and comprehensive report generation
How the testo 190 CFR software works
Programming of data loggers
Flexibly define start/stop conditions and measuring cycle
Easily manage calibration data
Configure up to eight data loggers in parallel
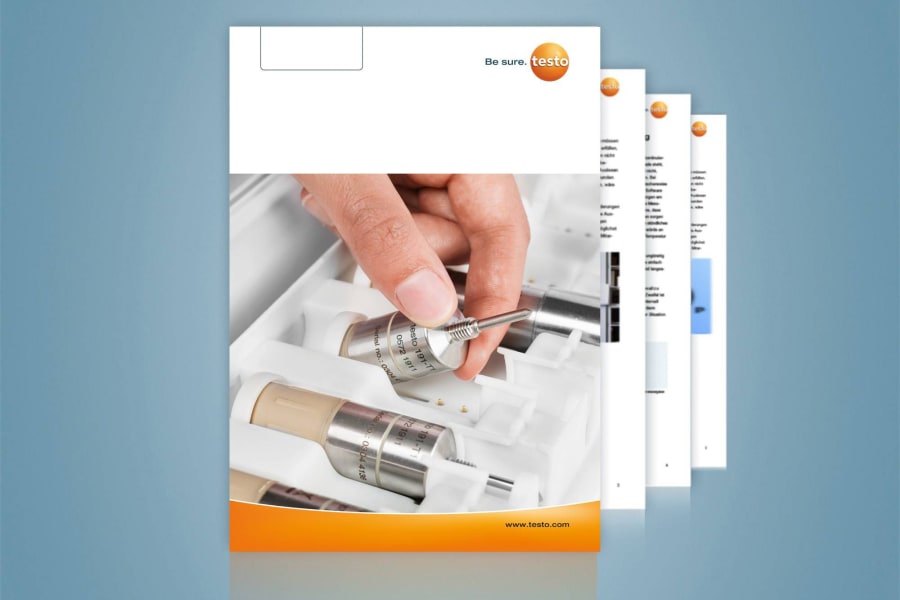
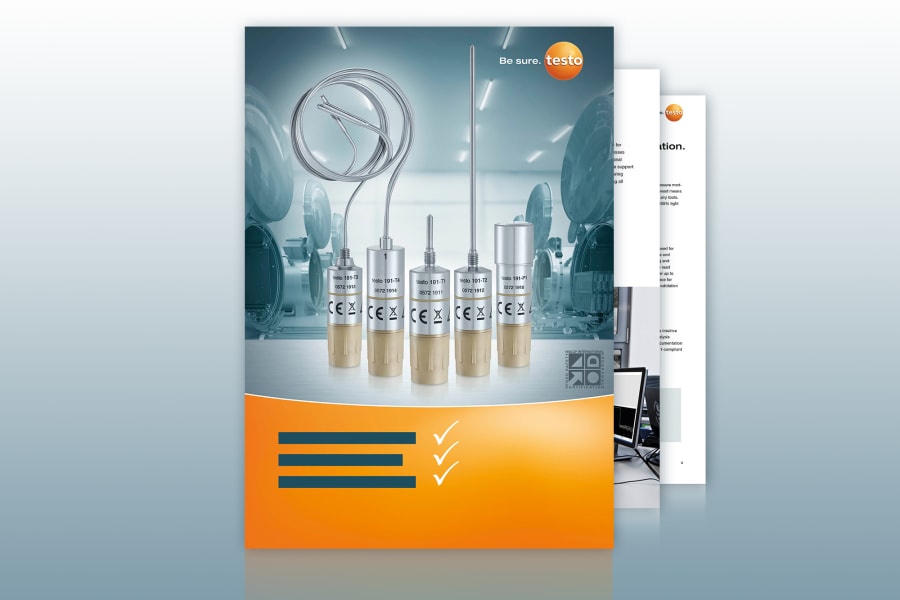
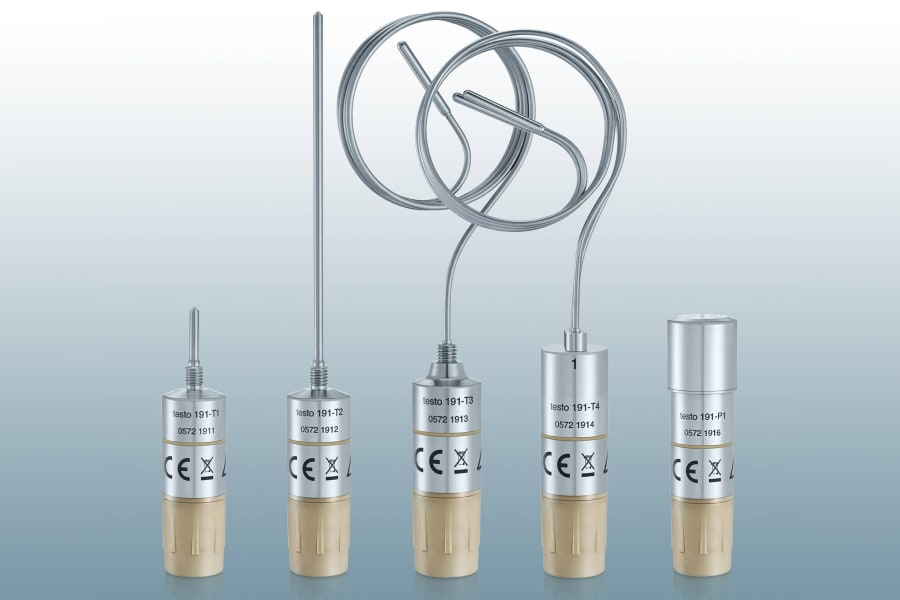
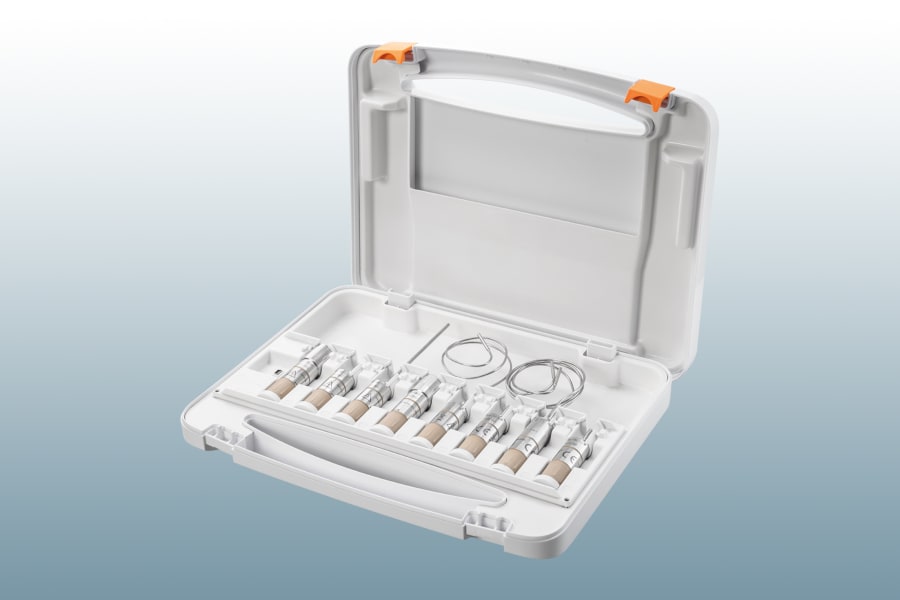
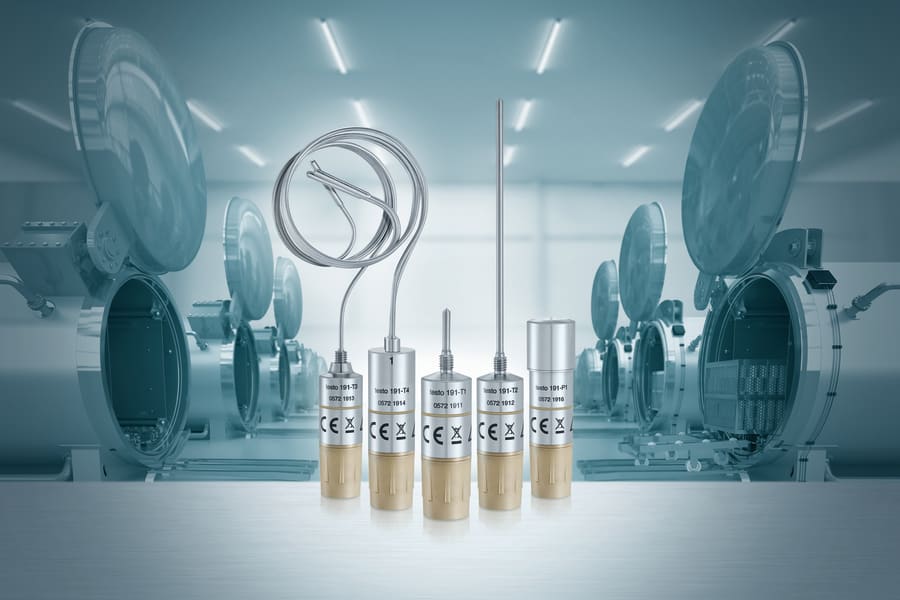
Further testo 191 system components
HACCP data loggers and Software Professional
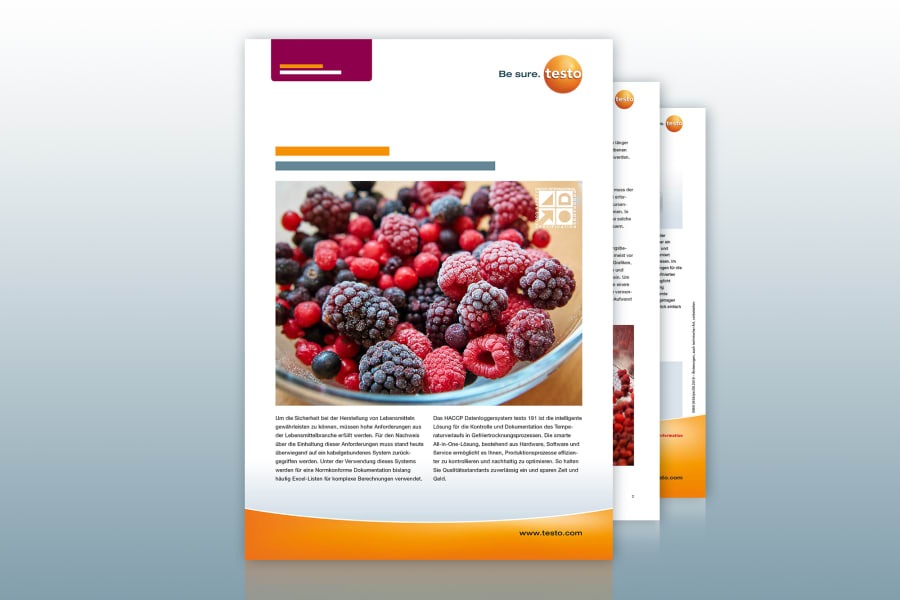
Which application interests you?
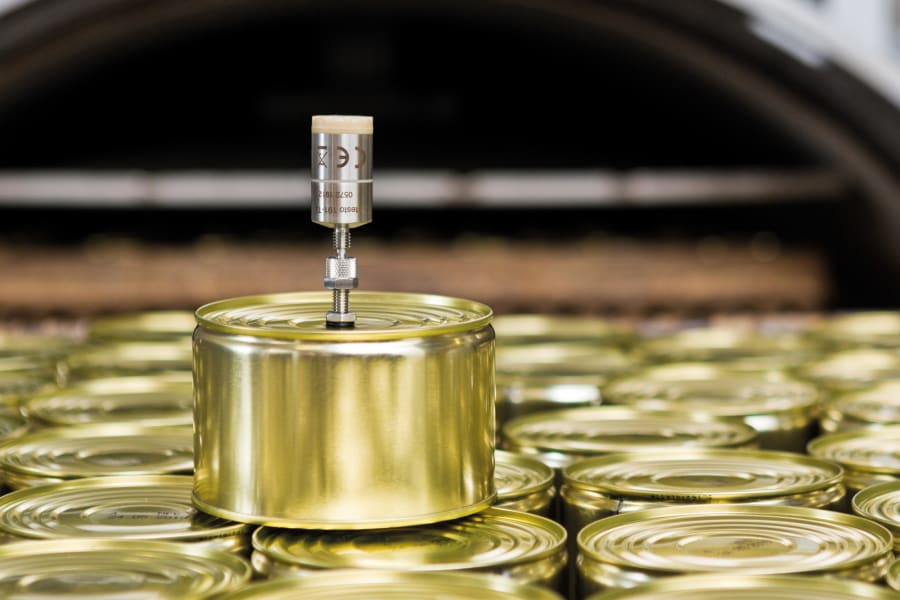
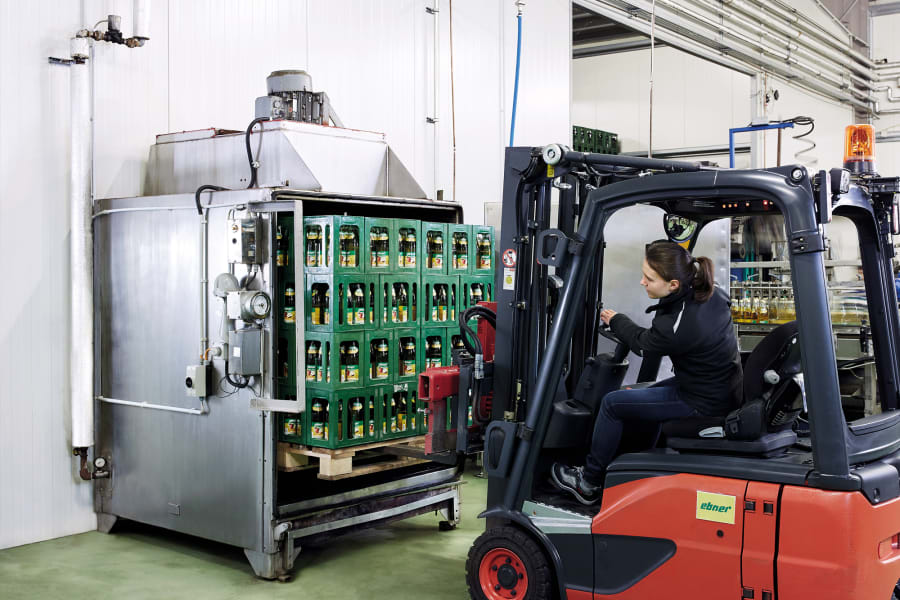
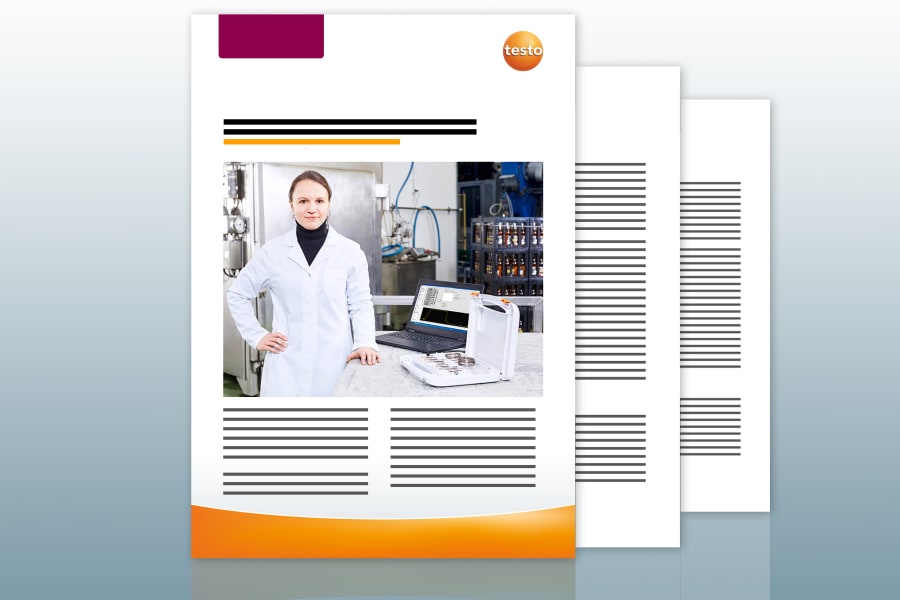
testo 191 loggers in endurance testing
Test procedures and results on:
Robustness
Accuracy drift
Reliability of the battery