


Choose Your Metric:
How to Turn Temperature Monitoring Data
into Risk Intelligence

In Pharmaceutical Environments, Data is Everywhere
Sensors record continuously. Systems generate alerts. Dashboards visualize conditions in real time. On paper, visibility has never been better. But visibility alone is not the goal.
Data acquisition, by itself, is not value-added. Value is created when monitoring data becomes something more: defensible, contextualized, and ultimately useful for risk-based decision-making.
That distinction matters. Because in regulated environments, it is not enough to collect data. You must be able to explain what it means, why it matters, and how it supports the decisions you make.
We have said it before. Data ownership is foundational. But ownership alone is not enough. The real question is: what are you measuring, and why?

The Illusion of Visibility
It is easy to assume that more data leads to better control. If temperatures are being recorded, excursions are flagged, and reports are archived, the system appears to be working. But this can create a false sense of confidence.
Collecting data is not the same as understanding exposure.
A temperature reading, on its own, does not describe risk. It does not account for duration, variability, or product sensitivity. It does not explain what actually happened to a product as it moved through a facility or across a distribution network.
Without context, data remains just that. Data.
The shift from visibility to insight requires a different approach. One that prioritizes not just what is measured, but how that measurement is defined, validated, and applied.
Measurement in Motion: Why Context Matters
Consider temperature monitoring in distribution.
It is common to rely on ambient weather data or generalized assumptions about environmental conditions. But supply chains are not static, and they are not equivalent to outdoor exposure.
A product moving from a loading dock to a truck, from a truck to an airport, from an aircraft to a warehouse, experiences a series of controlled and uncontrolled environments. Each transition introduces variability. Each dwell time changes the exposure profile.
Understanding that profile requires more than a single data point. It requires characterization.
Organizations that take a more advanced approach gather real-world data across specific shipping routes and use it to define actual exposure conditions. This allows them to move beyond assumptions and toward evidence-based decision-making.
The same principle applies within facilities. Temperature stratification in a warehouse, localized humidity variation, or airflow disruption in a controlled space can all influence conditions in ways that are not immediately visible without intentional measurement.
In both cases, the goal is the same: understand what the product actually experiences, not what you expect it to experience.
What Makes Data Defensible?
In regulated industries, data must do more than inform. It must stand up to scrutiny.
Defensible data is data that can be trusted, explained, and verified. That starts with how it is generated.
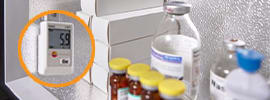
Instrumentation must be calibrated and traceable to recognized standards. Many organizations align their calibration practices with frameworks such as ISO 17025, which defines requirements for the competence of testing and calibration laboratories.
For pharmaceutical cold chain applications, sensor accuracy requirements typically range from ±0.5°C for standard monitoring to ±0.2°C or better for high-precision validation work, depending on application needs, product sensitivity, and regulatory requirements.
Measurement systems must be validated. Data integrity must be maintained across collection, transmission, storage, and reporting.
Just as importantly, the methodology behind the data must be sound. Where was the sensor placed? What interval was selected? What conditions were being simulated or observed?
Without that foundation, even large volumes of data can become difficult to defend.
And if data cannot be defended, it cannot reliably support compliance or quality decisions.
From Data Collection to Data Application
Once reliable data is established, its value depends on how it is used.
One of the most impactful applications is in qualification and validation activities. Real-world temperature data can be used to develop or refine environmental profiles for testing. These profiles can then be applied in controlled chambers to challenge packaging systems or storage conditions.
Instead of relying on generic or worst-case assumptions, organizations can simulate conditions that more accurately reflect actual risk.
This approach supports better decision-making in several ways:
Packaging configurations can be optimized based on real exposure conditions
Safety margins can be better understood and justified
Overengineering can be reduced, leading to cost efficiencies without compromising quality
In more advanced applications, this data can also support thermal modeling efforts, where environmental conditions are simulated digitally to predict product response under different scenarios.
In each case, the outcome is the same. Data moves from passive recordkeeping to active input in design and strategy.
Choosing the Metric That Matters
Not all temperature data is equally meaningful.
A single out-of-range alert may indicate a problem. Or it may represent a brief fluctuation with no impact on product quality. Without the right metric, it is difficult to distinguish between the two.
This is where measurement strategy becomes critical.
Different products, processes, and regulatory expectations require different ways of interpreting temperature data.
Some common approaches include:
Mean kinetic temperature (MKT), which accounts for the cumulative thermal stress experienced over time
Time out of range, which focuses on the duration of exposure beyond defined limits
Cumulative excursion impact, which considers both severity and duration of deviations
Each of these metrics tells a different story.
Choosing the right one depends on the stability profile of the product, the nature of the risk, and the decisions the data is meant to support.
For products whose degradation profiles don't follow simple Arrhenius kinetics, including many biologics and complex formulations, cumulative excursion analysis provides a more accurate picture of actual product impact than a single summary metric alone.
This is the core of Choose Your Metric. It is not about collecting more data. It is about defining the measurement approach that aligns with what actually matters.
From Compliance to Optimization
For many organizations, temperature monitoring begins as a compliance requirement.
Data is collected to demonstrate adherence to defined ranges. Reports are generated to satisfy audits. Deviations are investigated and documented.
But when measurement is approached strategically, it becomes something more.
Data can inform packaging design. It can refine distribution strategies. It can support risk assessments and continuous improvement efforts.
In this context, monitoring is no longer just about proving compliance. It is about enabling better decisions.
That shift requires intentionality. It requires understanding not just how to collect data, but how to define, interpret, and apply it.
Measure What Matters
The industry has made significant progress in data acquisition and visibility. But the next step is not more data; it is better measurement.
Own your data. Choose your metric. Turn insight into risk intelligence.
Because in the end, what you measure shapes the decisions you make. And in regulated environments, those decisions matter.
